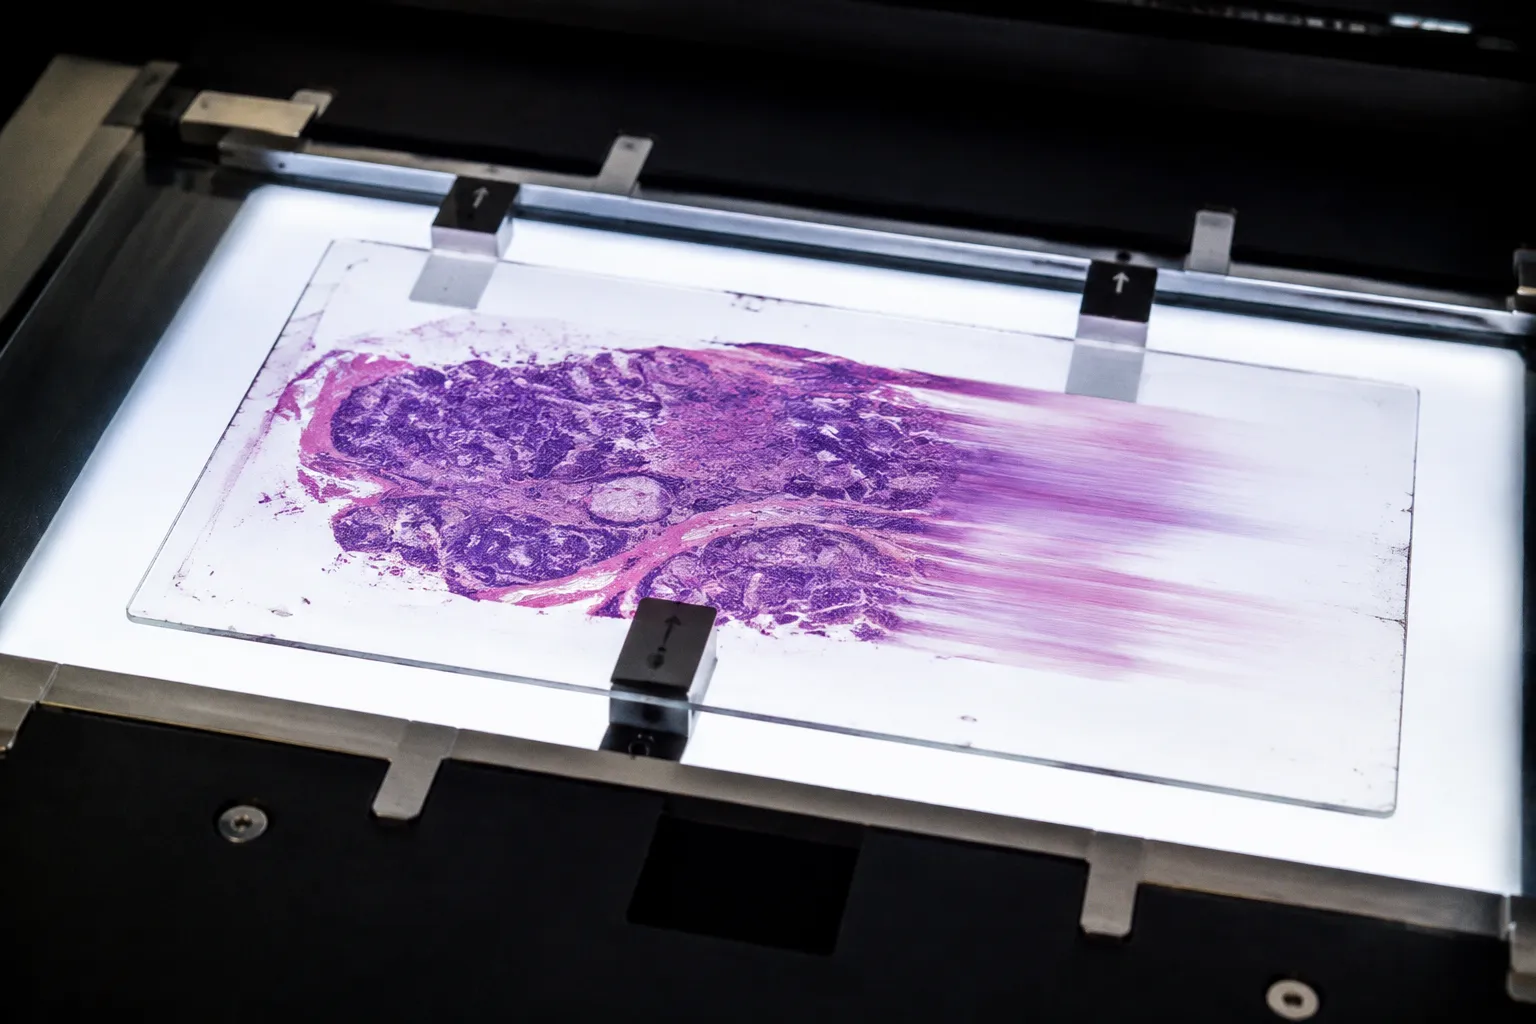
Many commercial slide scanners report focus scores in the high 90s — figures that, by their own internal calibration, suggest uniformly sharp, diagnostically sound whole slide images ready for downstream computational analysis. They are not. Empirical evaluation across hematoxylin and eosin (H&E) workflows demonstrates that even slides clearing this internal quality threshold can harbor unacceptable local blur — regions of defocus invisible to the scanner's own reporting logic but readily apparent to a pathologist navigating the virtual slide at high magnification. This latent defect, embedded silently within high-fidelity image datasets, represents one of the most underestimated failure modes in modern computational pathology and a structural obstacle to the paradigm of algorithm-driven tissue analysis.
A scanner-reported focus score in the high 90s does not constitute a quality certificate; it constitutes a hypothesis that still requires computational testing.
The implications extend well beyond individual case accuracy. As pathology laboratories progressively migrate from analog microscopy toward enterprise-scale digital archives, the assumption that acquisition-time metrics translate directly into diagnostic-grade fidelity has propagated through procurement contracts, regulatory submissions, and laboratory accreditation frameworks. Automated blur detection reorients this assumption, introducing a second, independent layer of analytical scrutiny between the scanner and the diagnostic workstation. The objective is not to replace technician review but to stratify it — to allow computational algorithms to perform the bulk of routine quality screening while preserving expert oversight for genuinely indeterminate cases.
The Fallacy of Scanner-Reported Focus Scores
The mechanics of slide scanning explain why internal focus metrics are insufficient as standalone quality indicators. A digital slide scanner acquires tissue sections through a tiled acquisition protocol, capturing a grid of adjacent fields of view, each of which undergoes a local autofocus routine at the moment of capture. The reported focus score is, in most commercial platforms, an aggregate of these per-field measurements — a weighted average that reflects the central tendency of the optical system across the slide rather than the worst-case performance at the periphery. Out-of-focus regions, particularly those arising from tissue folds, air bubbles trapped under the coverslip, or inconsistent section thickness, can occupy a small fraction of the total tile count and yet remain statistically invisible in the aggregate score.
This sampling problem has direct clinical consequences. A focus score of 98.5% may correspond to dozens of tiles per slide that fall below the diagnostic acceptance threshold for nuclear membrane definition, chromatin pattern resolution, or mitotic figure identification. At the magnifications required for surgical pathology — 40× equivalent and beyond — even sub-millimeter defocus compromises the morphological interpretation of cellular architecture. Downstream algorithms, including deep learning classifiers trained on sharp images, exhibit degraded performance when fed subtly blurred inputs, a phenomenon that has been documented across multiple computational pathology tasks.
The laboratories most exposed to this failure mode are those operating at high throughput: reference laboratories processing tens of thousands of slides per month, academic medical centers with continuous scanning schedules, and clinical trial biorepositories where every WSI must meet regulatory-grade quality standards. In these environments, manual visual inspection of every slide is operationally impossible, yet the consequences of letting blurred slides proceed to diagnosis are severe. Automated blur detection addresses this gap through algorithmic stratification rather than wholesale automation.
A further complication arises from the fact that scanner-reported scores are vendor-specific and not standardized across platforms. A score of 98 on one manufacturer's system does not necessarily correspond to the same optical quality as 98 on another. This lack of interoperability makes cross-platform quality benchmarking unreliable and reinforces the need for an independent, scanner-agnostic quality assessment layer that operates on the image data itself rather than on the acquisition instrument's proprietary metrics.
Mechanics of the MiQC Framework: LBP and DeepFocus Integration
The most extensively validated approach to computational blur detection in H&E-stained WSIs combines two complementary analytical engines within the MiQC framework: a Local Binary Patterns (LBP) texture descriptor and a deep convolutional neural network trained explicitly for focus classification. The integration is deliberate — each component addresses a failure mode that the other leaves exposed, and the combined system is designed to compensate for the weaknesses inherent in either approach used alone.
LBP texture analysis operates on the principle that out-of-focus regions produce characteristic statistical patterns in local pixel intensity gradients. Sharp images preserve high-frequency spatial detail, generating heterogeneous LBP distributions across tissue regions. Blurred images, by contrast, suppress high-frequency components and produce homogenized LBP signatures. The algorithm extracts these signatures from image patches, classifies them according to focus status, and produces a per-tile sharpness score that can be aggregated at the slide level.
DeepFocus-based neural networks provide a parallel evaluation mechanism, this one trained on expert-annotated image patches categorized as either diagnostically acceptable or unacceptable for focus. The deep learning component captures complex visual features that defy handcrafted texture descriptors, particularly the nuanced defocus patterns that arise from inconsistent section thickness or partial tissue overlap. In validated configurations, the consensus output of both engines — LBP and deep learning — has demonstrated the potential to reduce false-positive rejection of acceptable slides and false-negative acceptance of blurred regions relative to either signal evaluated independently, though the magnitude of this benefit depends on tissue type, staining protocol, and the quality of the training corpus.
The reported operational efficacy of this dual-engine approach is substantial. Across validated deployments, integrated computational blur detection enables 85% to 95% of WSIs to receive automated approval without manual technician intervention. The remaining 5% to 15% — slides flagged for elevated blur probability or heterogeneous focus distribution — are routed to technician review. This stratification is the operational core of the framework: not automation for its own sake, but selective delegation of routine quality decisions to algorithms while preserving expert capacity for indeterminate cases.
| Parameter | LBP Texture Descriptor | DeepFocus CNN |
|---|---|---|
| Input modality | Per-tile intensity gradients | Expert-annotated patch labels |
| Computational cost | Low, real-time capable | Moderate, GPU-dependent |
| Strength | Robust to staining variation | Captures complex defocus patterns |
| Limitation | Less sensitive to subtle defocus | Requires annotated training corpus |
| Role in MiQC | First-pass texture filter | Secondary classification refinement |
The choice of threshold between "acceptable" and "flagged for review" is not a static engineering constant — it is a clinical decision with operational consequences. Setting the threshold too aggressively produces high rescan volumes and erodes the throughput gains that justified the system's adoption. Setting it too permissively allows diagnostically compromised slides to reach the pathologist unreviewed. Most implementations therefore adopt a configurable threshold strategy, calibrated against a laboratory's specific tissue types, staining quality, and downstream analytical sensitivity requirements.
Addressing Preanalytical Artifacts: Tissue Folds and Air Bubbles
The dominant upstream causes of WSI blur originate not within the scanner but within the preanalytical phase of slide preparation. Tissue folds, air bubbles trapped beneath the coverslip, inconsistent microtome sectioning, and mounting medium inconsistencies each contribute distinct optical artifacts that propagate through the acquisition process and degrade image quality at the point of capture. Automated blur detection cannot eliminate these upstream defects, but it can identify slides where the artifacts have produced diagnostically compromising output, enabling targeted rescanning rather than wholesale slide replacement.
Tissue folds represent the most frequent source of locally blurred regions in routine H&E workflows. When a paraffin section folds over itself during transfer to the glass slide, the resulting double-layered region presents the optical system with two tissue planes at different depths — a configuration that no single focal setting can resolve sharply. The scanner captures both planes, but neither is rendered at the diagnostic acceptance threshold. LBP-based detection reliably flags these regions through their distinctive texture signatures, while deep learning models trained on annotated fold examples provide secondary confirmation.
Air bubbles under the coverslip introduce a different optical artifact: refractive index discontinuities that produce local magnification anomalies and contrast reduction. In severe cases, the affected regions appear visually transparent, presenting the appearance of absent tissue. In milder cases, the bubbles produce subtle defocus that degrades cellular detail without producing obviously anomalous image regions. Deep learning classifiers trained on diverse bubble morphologies have shown sensitivity to these subtle artifacts that handcrafted texture descriptors may not reliably capture, particularly when the bubble edge is gradual rather than sharply delineated and when the affected region retains partial tissue visibility.
The practical implication for laboratory operations is substantial. Rather than discarding affected slides and returning to the block for re-sectioning — a process that consumes technician time, degrades block integrity, and introduces turnaround delay — computational blur detection enables targeted rescanning. The scanner is directed to reacquire only the affected regions, producing a hybrid WSI in which the bulk of the slide originates from the original acquisition and the problematic regions are replaced with focused tiles from the rescan pass.
Mounting medium inconsistencies present a subtler challenge. Uneven application of the mounting medium or incomplete clearing during coverslip placement can produce focal plane variations across the slide that are neither as localized as a bubble nor as sharply delineated as a fold. These artifacts may span dozens of tiles and produce a gradual defocus gradient that evades simple threshold-based detection. In such cases, the spatial coherence analysis provided by heatmap-based blur mapping becomes particularly valuable, revealing the gradient structure rather than relying on per-tile binary classification.
Operational Impact: Scaling Throughput and Reducing Technician Burden
The economic argument for automated blur detection rests on a single operational metric: the redirection of technician attention from routine screening to genuinely indeterminate cases. Manual visual inspection of every WSI at high magnification is, at enterprise scale, a labor-intensive process that consumes skilled technical staff at rates incompatible with sustainable laboratory operations. A technician reviewing a single slide for blur requires several minutes of focused examination; multiplied across thousands of slides per week, this produces a labor cost structure that no reference laboratory can sustain without either expanding headcount or accepting reduced quality oversight.
Automated blur detection disrupts this arithmetic at its foundation. Across documented deployments, computational screening reduces technician quality control review time by nearly 50%, allowing the same technical staff to oversee substantially larger slide volumes without compromising oversight quality. The mechanism is straightforward: slides passing automated approval proceed directly to the diagnostic archive, while slides flagged for elevated blur probability are routed to technician review with annotated heatmaps indicating the specific regions of concern.
The downstream effect on laboratory throughput is multiplicative. Documented deployments report a 2× increase in slide quality control throughput per hour, derived from the combined effect of reduced per-slide review time and the selective concentration of expert attention on problematic cases. For a reference laboratory processing 20,000 slides per month, this throughput gain translates into either reduced staffing requirements, increased capacity within existing staffing constraints, or reallocation of technical expertise to higher-value preanalytical and analytical tasks.
The regulatory dimension is equally significant. Accreditation frameworks including CLIA, CAP, and ISO 15189 increasingly require demonstrable quality control procedures for digital pathology workflows. Automated blur detection provides a documented, auditable, and reproducible quality control mechanism that satisfies regulatory expectations while simultaneously improving operational performance. The dual nature of this benefit — compliance and efficiency — explains the rapid adoption trajectory of computational QC tools across enterprise-scale pathology operations.
A less immediately visible but equally important operational benefit is the feedback loop between blur detection data and preanalytical process improvement. When computational QC identifies recurring blur patterns — the same tissue type folding consistently, a specific staining station producing mounting defects, a particular technician's sectioning yielding higher fold rates — the laboratory gains actionable intelligence about upstream process failures. Blur detection becomes not only a gatekeeping mechanism but a diagnostic instrument for the slide preparation pipeline itself, enabling root-cause analysis that would be invisible under manual spot-checking regimes.
Implementing Heatmap-Driven Rescanning Workflows
The most consequential operational innovation enabled by automated blur detection is the transition from binary accept/reject decisions to spatially resolved quality assessment. Heatmap-driven rescanning workflows produce per-slide visualizations in which the location and severity of focus degradation are explicitly displayed, enabling both automated and human reviewers to direct attention efficiently. A slide receiving automated approval carries no flagged regions; a slide routed for review carries a precise map of the affected coordinates.
The heatmap output serves multiple operational functions simultaneously. For automated rescanning protocols, the heatmap defines the target region set for reacquisition — the scanner returns to the specified coordinates, adjusts focal parameters, and captures replacement tiles that are stitched into the existing WSI. For technician review, the heatmap directs visual attention to the precise regions requiring expert evaluation, eliminating the search time that would otherwise be consumed in scanning the entire slide.
The implementation architecture typically involves three integrated components. The first is a real-time inference engine that processes WSIs as they complete acquisition, generating per-tile focus classifications within minutes of scan completion. The second is a routing layer that directs approved slides to the diagnostic archive and flagged slides to the appropriate review queue — either technician or scanner rescan — based on configurable thresholds. The third is a heatmap rendering module that produces the visualization interface consumed by both human reviewers and automated rescanning protocols.
Computational blur detection transforms quality control from a sampling exercise into a comprehensive spatial audit, documenting the focus status of every tile on every slide.
The configuration parameters governing this workflow deserve careful laboratory-specific calibration. The blur threshold defining acceptable versus unacceptable focus varies across tissue types, staining protocols, and downstream analytical applications. A laboratory supporting primarily H&E-based diagnostic interpretation may tolerate slightly more blur than one feeding WSIs into deep learning classifiers sensitive to subtle morphological features. The implementation framework must therefore support per-protocol threshold management, with audit trails documenting threshold changes and their downstream effects on approval rates and rescan volumes.
The rescanning workflow itself introduces a secondary quality consideration: tile stitching artifacts at the boundary between original and replacement acquisitions. Differences in illumination, color calibration, or focal positioning between the original scan pass and the rescanning pass can produce visible seams in the hybrid WSI. Production-grade implementations mitigate this through matched illumination profiles and boundary-blending algorithms, but the laboratory must verify that hybrid WSIs meet the same diagnostic acceptance criteria as conventionally acquired slides.
The Forward Trajectory of Computational QC
The trajectory of automated blur detection points toward progressive integration with broader computational quality control frameworks. Focus assessment is one component of a larger quality envelope that includes stain intensity normalization, tissue detection accuracy, artifact identification, and color consistency evaluation. The architectural pattern established by MiQC — dual algorithmic engines producing consensus assessments with stratified routing — provides a template for each subsequent quality dimension.
The laboratory operations most likely to benefit from this expanded framework are those at the frontier of computational pathology adoption: institutions deploying deep learning classifiers for tumor detection, biomarker quantification, and prognostic stratification. These applications exhibit elevated sensitivity to image quality variation, and the cost of a misclassified case — whether false positive or false negative — is substantially higher than in conventional visual interpretation. Automated blur detection provides the quality floor upon which these applications can be deployed with confidence.
The market trajectory reflects this clinical reality. As digital pathology adoption accelerates across diagnostic, research, and pharmaceutical contexts, the demand for computationally validated quality assurance is growing in parallel. The laboratories investing in automated blur detection today are not merely solving an operational inconvenience — they are building the quality infrastructure required to sustain the next generation of algorithm-driven diagnostic workflows, where the cost of an undetected quality failure scales with the ambition of the analytical pipeline it feeds.